
Using Visuals in Canvas
Introduction
A picture is worth a thousand words. You’ve likely heard this sentiment or variations of it, which can be traced to pre-1900 writings and throughout advertising. Regardless of where the phrase comes from, the meaning of the sentiment is this: the human brain is wired for visuals. In this article, we will explore reasons you should include visuals in your teaching practice, types of visuals for you to consider, best practices for selecting and incorporating visuals, and where to find visual materials.
Why include visuals in online learning
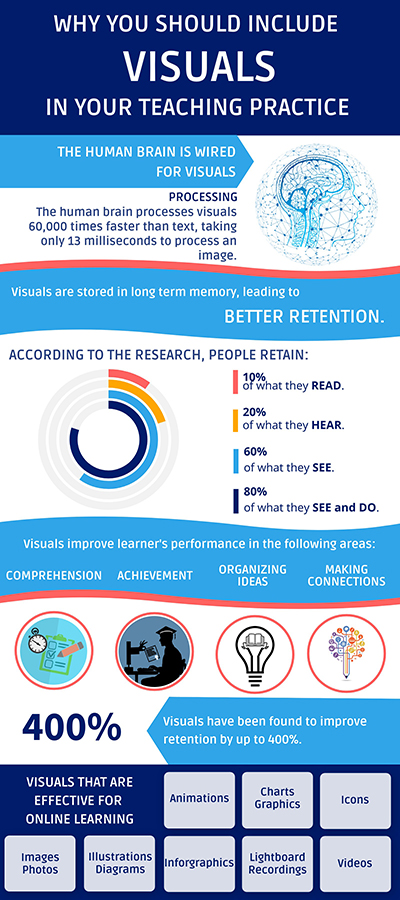
The human brain processes visuals 60,000 times faster than text, taking only 13 milliseconds to process an image (Trafton, 2014). Visuals are an effective form of communication that help students to retain visual content in long term storage longer, while increasing engagement and lightening cognitive load. Visuals in engineering courses also help students understand complex content and make deeper connections using multiple means of representation (Grout, 2022; Opfermann et al., 2017).
This leads to:
- Higher reading comprehension.
- Increase of student achievement.
- Better graphic organization of ideas.
- Greater ability to find patterns and make connections with the content.
The human brain processes visuals 60,000 times faster than text, taking only 13 milliseconds to process an image (Trafton, 2014).
Types of visuals to include in online learning
Animations
Animation is a technique of showing a series of images or drawings to show a sequence. It is a dynamic representation of course content that shows students the changes that occur in complex processes allowing for the easy transfer of knowledge and enhancing understanding (Rosen, 2009).
Charts and Graphs
Charts and graphs are useful to highlight trends and explain complex relations to various types of data. Depending on the data, a graph showing a growth over time will be far more effective than a table of numbers alone. For example, consider including pie charts to show percentages of a whole and bar or line charts to highlight trends over time. Whatever the data, there is a visualization to better help students consume the important concepts.
Icons
Icons provide a concise way for students to quickly scan and visually organize information. Many icons are familiar to students and reduce cognitive load whenever those icons appear. A common example would be the instantly recognizable printer icon. Canvas icons help students to distinguish between assignments, discussions, and pages. Bulleted lists act in a similar way as icons by providing visual organization and reducing cognitive load.
Illustrations
Illustrations provide a great way to simplify complex concepts into organized and manageable chunks, such as illustrations of complex machinery and software or processes such as workflows and product lifecycles (Opfermann et al., 2017). They can also emphasize complex patterns or relations that are difficult to convey by words alone.
Images and Photos
Images and photos reduce cognitive load while also grabbing the user’s attention, evoking emotion, and enticing user productivity.
- Use quality, high-resolution images.
- Avoid generic stock photos that are not directly relevant to learning outcomes.
- When including images of people, consider inclusive images that students can relate to.
Infographics
Infographics tell stories. They allow you to communicate a lot of information to students in a visually appealing and compelling manner. Consider the infographic included in this article and how your eye was immediately drawn to it as an example of why you should consider this highly effective visual in your course content.
Interactive images
You can also enrich an image by adding interactivity that encourages users to dig deeper into the concepts. Interactive images allow you to add additional resources such as text, video or other embedded content to any image. See this example of labeled parts of the brain. Here is another example: an interactive image that shows examples of each of the types of visuals discussed in this article.
Lightboard Recording
Videos
Videos are one of the most effective forms of course content in online education. Whether a voice over PowerPoint, or depicting a concept, video is used in many EP courses allowing faculty to share complex processes seamlessly during asynchronous courses.
Visuals in engineering courses also help students understand complex content and make deeper connections using multiple means of representation (Grout, 2022; Opfermann et al., 2017).
Best Practices for Including Images in Your Course
Relevant:
Be sure to select visuals that are relevant to the topic and represent a diverse audience.
Quality:
Quality matters. Choose only high-resolution visuals to avoid media that is difficult to read or pixelated when students enlarge the image.
Accessibility:
Inclusive teaching practices consider the fact that some learners have visual impairments. Be sure to follow accessibility best practices using alternative text, a simple description, or caption, to describe visual elements so all learners can connect with your content.
Copyright:
Be mindful of basic copyright concerning course content that you have not created. The Sheridan Library Guide on copyright is a good place to learn more.
Where to find images
The Sheridan Library Guide on Images and Copyright shares a few places you can find images to use in your course materials. Along with those, here are a few of our favorites:
Keywords: Canvas, Engineering Education, LMS Learning Management System, Tech Tips